

Unlocking the Power of Percentages in Excel
Microsoft Excel is an indispensable tool for data analysis, financial modeling, and countless other applications. At the heart of many analyses lies the concept of percentages. Whether you’re calculating sales growth, profit margins, or survey results, understanding how to work with percentages in Excel is crucial. This comprehensive guide will walk you through everything you need to know, from basic calculations to advanced techniques, ensuring you can confidently tackle any percentage-related task.
Why Percentages Matter
Percentages provide a standardized way to express proportions and relative changes. They simplify comparisons and offer insights that raw numbers often obscure. Imagine you’re comparing the sales performance of two products. Product A sold 150 units, while Product B sold 200 units. At first glance, Product B seems to be performing better. However, if Product A had a sales target of 100 units and Product B had a target of 300 units, the percentage of target achieved tells a different story. Product A achieved 150% of its target, while Product B only achieved 66.67%. Percentages reveal the true performance relative to the initial goals.
Basic Percentage Calculations in Excel
Let’s start with the fundamentals. Excel treats percentages as numbers divided by 100. So, 25% is internally represented as 0.25. This understanding is crucial for performing calculations correctly.
Displaying Numbers as Percentages
The easiest way to display a number as a percentage is to use the percentage format. Here’s how:
- Select the cell(s) containing the numbers you want to format.
- Go to the Home tab on the Excel ribbon.
- In the Number group, click the % (Percent Style) button. Alternatively, you can use the keyboard shortcut Ctrl + Shift + %.
Excel will automatically multiply the number by 100 and add the percentage symbol (%). For example, 0.15 will be displayed as 15%.
Calculating Percentage of a Total
One of the most common percentage calculations is finding what percentage one number represents of another. The formula is simple:
Percentage = (Part / Total) * 100
In Excel, this translates to:
- Enter the ‘Part’ value in one cell (e.g., A1).
- Enter the ‘Total’ value in another cell (e.g., B1).
- In a third cell (e.g., C1), enter the formula
=A1/B1. - Format cell C1 as a percentage using the steps described above.
For instance, if you want to know what percentage 30 is of 200, enter 30 in A1, 200 in B1, and the formula =A1/B1 in C1. Formatting C1 as a percentage will display 15%.
Calculating Percentage Change
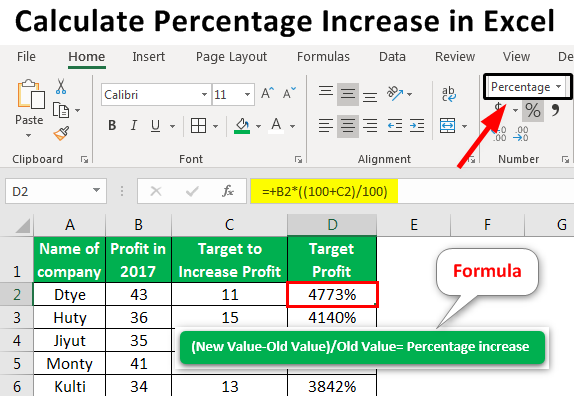
Calculating percentage change is essential for tracking growth, decline, or any fluctuation over time. The formula is:
Percentage Change = ((New Value - Old Value) / Old Value) * 100
Here’s how to implement it in Excel:
- Enter the ‘Old Value’ in one cell (e.g., A1).
- Enter the ‘New Value’ in another cell (e.g., B1).
- In a third cell (e.g., C1), enter the formula
=(B1-A1)/A1. - Format cell C1 as a percentage.
For example, if your sales increased from 500 units last month (A1) to 600 units this month (B1), the formula =(B1-A1)/A1 in C1 will result in 0.2, which, when formatted as a percentage, displays 20%.
Advanced Percentage Techniques in Excel
Once you’ve mastered the basics, you can explore more advanced techniques to handle complex scenarios.
Calculating Percentage Difference
Percentage difference is used to compare two values and determine the relative difference between them. The formula is:
Percentage Difference = (|Value1 - Value2| / ((Value1 + Value2) / 2)) * 100
The absolute value (represented by | |) ensures the result is always positive, indicating the magnitude of the difference, not the direction.
In Excel:
- Enter ‘Value1’ in cell A1 and ‘Value2’ in cell B1.
- In cell C1, enter the formula
=ABS(A1-B1)/((A1+B1)/2). - Format cell C1 as a percentage.
For example, if Value1 is 80 and Value2 is 100, the percentage difference is calculated as =ABS(80-100)/((80+100)/2), which equals 0.2222 or 22.22%.
Calculating Compound Growth Rate (CAGR)
The Compound Annual Growth Rate (CAGR) is a useful metric for evaluating the growth of an investment or business over multiple years. It smooths out the volatility to provide an average annual growth rate.
The formula is:
CAGR = ((Ending Value / Beginning Value)^(1 / Number of Years)) - 1
In Excel:
- Enter the ‘Beginning Value’ in cell A1.
- Enter the ‘Ending Value’ in cell B1.
- Enter the ‘Number of Years’ in cell C1.
- In cell D1, enter the formula
=(B1/A1)^(1/C1)-1. - Format cell D1 as a percentage.
For instance, if a company’s revenue increased from $1 million in 2018 to $1.5 million in 2023 (5 years), the CAGR is calculated as =(1500000/1000000)^(1/5)-1, which equals approximately 0.0845 or 8.45%.
Using Percentages with Conditional Formatting
Conditional formatting allows you to visually highlight cells based on their values, making it easier to identify trends and outliers. You can use percentages to set the criteria for conditional formatting.
Here’s how:
- Select the range of cells you want to format.
- Go to the Home tab and click on Conditional Formatting.
- Choose a formatting rule, such as Highlight Cells Rules or Top/Bottom Rules.
- For example, to highlight cells with values greater than 10% above the average, select Highlight Cells Rules > Greater Than.
- In the dialog box, enter
=AVERAGE($A$1:$A$10)*1.1(assuming your data is in A1:A10). This formula calculates 110% of the average. - Choose a formatting style and click OK.
This will highlight all cells in the selected range that are more than 10% above the average, providing a quick visual indicator of high-performing values.
Calculating Weighted Averages with Percentages
Weighted averages are used when different data points have different levels of importance. Percentages often represent these weights.
The formula for a weighted average is:
Weighted Average = (Value1 * Weight1) + (Value2 * Weight2) + ... + (ValueN * WeightN)
Where the weights are expressed as percentages and sum up to 100%.
In Excel:
- Enter the values in one column (e.g., A1:A3).
- Enter the corresponding weights (as decimals) in another column (e.g., B1:B3). Ensure the weights sum up to 1.
- In a cell (e.g., C1), enter the formula
=SUMPRODUCT(A1:A3,B1:B3).
For example, if you have three exam scores (80, 90, 75) with weights of 30%, 40%, and 30% respectively, the weighted average is calculated as =SUMPRODUCT({80,90,75},{0.3,0.4,0.3}), which equals 83.5.
Practical Applications of Percentages in Excel
Let’s explore some real-world scenarios where percentage calculations in Excel are invaluable.
Financial Analysis: Profit Margins
Calculating profit margins is crucial for assessing the profitability of a business. Gross profit margin, operating profit margin, and net profit margin provide insights into different aspects of financial performance.
Gross Profit Margin:
Gross Profit Margin = ((Revenue - Cost of Goods Sold) / Revenue) * 100
Operating Profit Margin:
Operating Profit Margin = (Operating Income / Revenue) * 100
Net Profit Margin:
Net Profit Margin = (Net Income / Revenue) * 100
You can easily calculate these margins in Excel by entering the relevant financial data and applying the formulas. Comparing these margins over time or against industry benchmarks helps identify areas for improvement.
Sales Analysis: Growth Rate
Tracking sales growth is essential for understanding the performance of a product, service, or overall business. The percentage change formula we discussed earlier is perfect for this:
Percentage Change = ((New Sales - Old Sales) / Old Sales) * 100
By calculating sales growth rates month-over-month, quarter-over-quarter, or year-over-year, you can identify trends, evaluate the effectiveness of marketing campaigns, and make informed decisions about inventory and resource allocation. Consistent growth signifies a healthy business, while declining growth rates may indicate the need for strategic adjustments.
Project Management: Task Completion
In project management, tracking the percentage of task completion is vital for monitoring progress and ensuring projects stay on schedule. You can create a simple Excel sheet with tasks, their estimated duration, and the actual time spent. Then, calculate the percentage of task completion using the formula:
Percentage Complete = (Actual Time Spent / Estimated Duration) * 100
This allows you to quickly identify tasks that are behind schedule and take corrective action. Visualizing the percentage completion using charts or conditional formatting can further enhance project monitoring.
Survey Analysis: Response Rates
When conducting surveys, calculating response rates is crucial for assessing the representativeness of the data. The response rate is the percentage of people who completed the survey out of the total number of people invited.
Response Rate = (Number of Responses / Number of Invitations) * 100
A higher response rate generally indicates a more reliable and representative sample. Analyzing response rates across different demographics or segments can also reveal valuable insights about who is and isn’t participating in the survey.
Tips and Tricks for Working with Percentages in Excel
- Use Named Ranges: Instead of referring to cells by their addresses (e.g., A1, B2), use named ranges to make your formulas more readable and maintainable. For example, you can name cell A1 as “Sales” and cell B1 as “Target”. Then, your formula becomes
=Sales/Target, which is much easier to understand. - Lock Cell References: When copying formulas, use absolute cell references (e.g., $A$1) to prevent the references from changing. This is particularly useful when you want to compare a range of values against a single value.
- Error Handling: Use the IFERROR function to handle potential errors, such as division by zero. For example,
=IFERROR(A1/B1,0)will return 0 if B1 is zero, preventing the #DIV/0! error. - Data Validation: Use data validation to ensure that users enter valid percentage values (e.g., between 0% and 100%). This helps prevent errors and ensures data integrity.
- Keyboard Shortcuts: Learn and use keyboard shortcuts to speed up your workflow. Some useful shortcuts for working with percentages include Ctrl + Shift + % (Percent Style), Ctrl + 1 (Format Cells dialog box), and Alt + = (AutoSum).
Common Mistakes to Avoid
- Forgetting to Format as Percentage: Ensure that you format the cells containing percentage values as percentages. Otherwise, Excel will treat them as regular numbers, leading to incorrect results.
- Incorrectly Interpreting Percentage Change: Be mindful of the base value when calculating percentage change. A 10% increase followed by a 10% decrease does not result in the original value.
- Ignoring Weighted Averages: When dealing with data points of varying importance, use weighted averages instead of simple averages to get a more accurate representation.
- Rounding Errors: Be aware of rounding errors, especially when dealing with a large number of calculations. Use the ROUND function to control the precision of your results.
- Not Validating Data: Always validate your data to ensure its accuracy and consistency. Incorrect data can lead to misleading percentage calculations and flawed conclusions.
Conclusion: Percentages – Your Key to Data Insights
Mastering percentages in Excel unlocks a powerful tool for data analysis, decision-making, and problem-solving. From basic calculations like finding the percentage of a total to advanced techniques like calculating CAGR and weighted averages, understanding how to work with percentages is essential for anyone who wants to extract meaningful insights from data.
By following the guidelines and examples presented in this comprehensive guide, you can confidently tackle any percentage-related task in Excel and gain a deeper understanding of your data. So, dive in, experiment with the formulas, and unleash the power of percentages to drive informed decisions and achieve your goals. Happy calculating!
