How to Calculate Mean Absolute Deviation: A Step-by-Step Guide
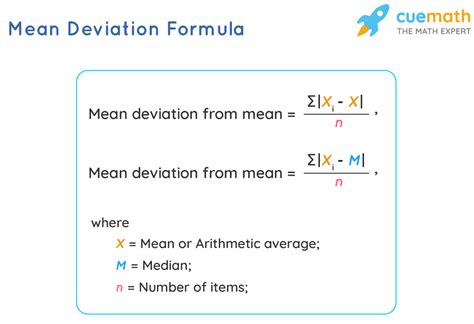
The Mean Absolute Deviation (MAD) is a simple yet powerful statistical measure that quantifies the average distance between each data point and the mean of the dataset. It's a valuable tool for understanding the dispersion or spread of your data, offering a more intuitive interpretation than standard deviation for some audiences. This guide will walk you through the calculation process step-by-step.
Understanding the Concept
Before diving into the calculations, let's grasp the core concept. The MAD isn't concerned with whether data points are above or below the average; it only cares about how far they are from the average. This makes it a robust measure less sensitive to outliers than standard deviation.
Steps to Calculate Mean Absolute Deviation
Let's break down the calculation into manageable steps using a sample dataset: 10, 12, 15, 18, 20.
Step 1: Calculate the Mean
The first step is to find the arithmetic mean (average) of your dataset. This is done by summing all the values and then dividing by the number of values.
- Sum of values: 10 + 12 + 15 + 18 + 20 = 75
- Number of values: 5
- Mean: 75 / 5 = 15
Step 2: Find the Absolute Deviations
Next, calculate the absolute deviation for each data point. This involves subtracting the mean from each data point and then taking the absolute value (ignoring any negative signs).
- |10 - 15| = 5
- |12 - 15| = 3
- |15 - 15| = 0
- |18 - 15| = 3
- |20 - 15| = 5
Step 3: Calculate the Average of the Absolute Deviations
Finally, find the average of the absolute deviations calculated in Step 2. This average is the Mean Absolute Deviation.
- Sum of absolute deviations: 5 + 3 + 0 + 3 + 5 = 16
- Number of absolute deviations: 5
- Mean Absolute Deviation (MAD): 16 / 5 = 3.2
Interpreting the Mean Absolute Deviation
In our example, the MAD is 3.2. This tells us that, on average, each data point is 3.2 units away from the mean of 15. A lower MAD indicates that the data points are clustered closely around the mean, while a higher MAD suggests greater dispersion.
When to Use Mean Absolute Deviation
The MAD is particularly useful in scenarios where:
- Outliers are a concern: Because it uses absolute values, MAD is less sensitive to outliers than standard deviation.
- Simplicity is desired: The calculation is straightforward and easily understood, making it a good choice for audiences unfamiliar with complex statistical concepts.
- Data is not normally distributed: MAD is not as reliant on the assumption of normality as standard deviation.
Mean Absolute Deviation vs. Standard Deviation
While both MAD and standard deviation measure data dispersion, they differ significantly in their calculation and interpretation. Standard deviation squares the deviations before averaging, making it more sensitive to outliers. The choice between them depends on the specific needs of your analysis and the characteristics of your data.
Conclusion
Calculating the Mean Absolute Deviation is a valuable skill for anyone working with data. By following these simple steps, you can gain a clearer understanding of your data's spread and make more informed decisions. Remember to choose the measure of dispersion (MAD or standard deviation) that best suits your data and analytical goals.
