How to Get Relative Frequency: A Simple Guide
Understanding relative frequency is crucial for various fields, from statistics and data analysis to market research and even everyday decision-making. This guide will walk you through calculating relative frequency, explaining its significance, and providing practical examples.
What is Relative Frequency?
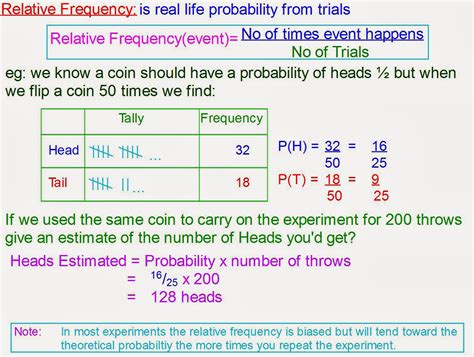
Relative frequency represents the proportion or percentage of times a particular value or event occurs within a dataset. Unlike absolute frequency (which simply counts occurrences), relative frequency contextualizes the data by showing its prevalence compared to the whole. It's expressed as a fraction, decimal, or percentage.
In simpler terms: Imagine you have a bag of marbles with different colors. Relative frequency tells you the percentage of marbles that are, say, red, compared to the total number of marbles.
How to Calculate Relative Frequency
The calculation is straightforward:
Relative Frequency = (Frequency of a Specific Value) / (Total Number of Values)
Let's break it down step-by-step:
-
Count the Frequency: Determine how many times each value appears in your data set. This is your absolute frequency.
-
Find the Total: Add up all the frequencies to get the total number of observations.
-
Divide: Divide the frequency of each individual value by the total number of values. This gives you the relative frequency for each value.
-
Convert to Percentage (Optional): Multiply the relative frequency by 100 to express it as a percentage.
Example: Calculating Relative Frequency of Colors
Let's say we have a bag of 20 marbles with the following color distribution:
- Red: 8
- Blue: 5
- Green: 4
- Yellow: 3
Here's how to calculate the relative frequency:
Total Marbles: 20
- Red: (8/20) = 0.4 or 40%
- Blue: (5/20) = 0.25 or 25%
- Green: (4/20) = 0.2 or 20%
- Yellow: (3/20) = 0.15 or 15%
Applications of Relative Frequency
Relative frequency is used extensively across various disciplines:
- Statistics: Describing data distributions, probability calculations.
- Market Research: Analyzing customer preferences, product demand.
- Quality Control: Identifying defect rates in manufacturing.
- Scientific Studies: Evaluating experimental results, analyzing survey data.
Why Use Relative Frequency?
- Easier Comparison: Relative frequency allows for easy comparison of different datasets, even if they have different sample sizes.
- Contextual Understanding: Provides a clearer picture of the proportion of each value within the data.
- Probability Estimation: Can be used as an estimate of probability for future events.
Conclusion
Calculating relative frequency is a fundamental skill with wide-ranging applications. By following the simple steps outlined above, you can effectively analyze your data and gain valuable insights. Remember to always clearly define your values and ensure accurate counting for precise results. This will significantly improve your data analysis and interpretation skills.
