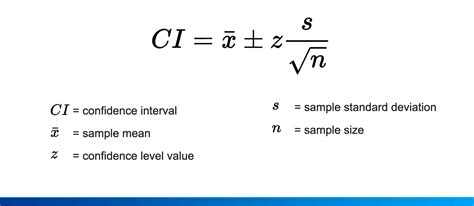
How to Calculate Confidence Level: A Simple Guide
Understanding confidence levels is crucial for anyone working with data analysis, statistics, or research. A confidence level expresses the probability that a population parameter falls within a specified range of values, based on sample data. This guide will demystify the process and show you how to calculate confidence levels.
What is a Confidence Level?
Before diving into calculations, let's clarify what a confidence level actually represents. It's the probability that your confidence interval contains the true population parameter. For example, a 95% confidence level means that if you were to repeat your sampling process many times, 95% of the resulting confidence intervals would contain the true population parameter.
Key Terms:
- Population Parameter: The true value of a characteristic in the entire population (e.g., the average height of all adults). This is often unknown and what we're trying to estimate.
- Sample: A subset of the population used for data collection.
- Confidence Interval: A range of values within which the population parameter is likely to fall.
- Confidence Level: The probability that the confidence interval contains the true population parameter.
- Significance Level (α): The probability of rejecting the null hypothesis when it's actually true (often 0.05 or 5%). This is related to the confidence level: Confidence Level = 1 - α.
Calculating Confidence Level: A Step-by-Step Guide
Calculating a confidence level involves several steps:
1. Determine the Sample Statistics
You need to calculate the sample mean (x̄) and the sample standard deviation (s) from your data. Many statistical software packages and even spreadsheets like Excel can easily compute these values.
2. Choose Your Confidence Level
The most common confidence levels are 90%, 95%, and 99%. The choice depends on the desired level of certainty. A higher confidence level means a wider confidence interval.
3. Find the Critical Value (z-score or t-score)
This step depends on whether you know the population standard deviation (σ).
-
If you know σ (Population Standard Deviation): Use the Z-score. You can find the z-score corresponding to your chosen confidence level using a Z-table or a statistical calculator. For example:
- 90% confidence level: z = 1.645
- 95% confidence level: z = 1.96
- 99% confidence level: z = 2.576
-
If you don't know σ (Population Standard Deviation - more common): Use the t-score. This requires knowing your sample size (n). You'll need a t-table or a statistical calculator, specifying your degrees of freedom (df = n - 1) and your chosen confidence level.
4. Calculate the Margin of Error
The margin of error indicates the amount added and subtracted from the sample mean to create the confidence interval. The formula is:
Margin of Error = Critical Value * Standard Error
Where the standard error is calculated as:
- Standard Error (with known σ): Standard Error = σ / √n
- Standard Error (with unknown σ): Standard Error = s / √n (where 's' is the sample standard deviation)
5. Calculate the Confidence Interval
Finally, calculate the confidence interval using the following formula:
Confidence Interval = Sample Mean ± Margin of Error
This gives you a range of values within which you can be confident (at your chosen level) the true population parameter lies.
Example: Calculating a 95% Confidence Interval
Let's say you have a sample of 25 students, and their average test score is 78 (x̄) with a sample standard deviation of 8 (s). We want a 95% confidence interval. Since we don't know the population standard deviation, we use the t-score. With 24 degrees of freedom (25-1) and a 95% confidence level, the t-score is approximately 2.064.
- Standard Error: 8 / √25 = 1.6
- Margin of Error: 2.064 * 1.6 = 3.3024
- Confidence Interval: 78 ± 3.3024 = (74.6976, 81.3024)
Therefore, we can be 95% confident that the true average test score for all students lies between 74.7 and 81.3.
Remember to choose the appropriate method (z-score or t-score) based on whether you know the population standard deviation. This guide provides a foundation for understanding and calculating confidence levels; mastering it enhances your data analysis skills significantly.
